Covid-19 Case Fitting Curves - USA
Last update: 09/01/2021 (dd/mm/yyyy)
4. States
4.20. Minnesota
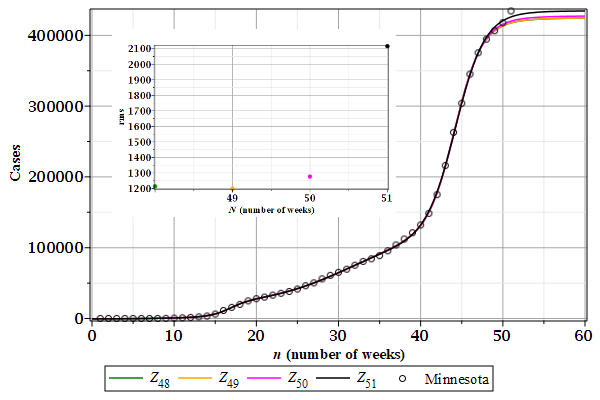
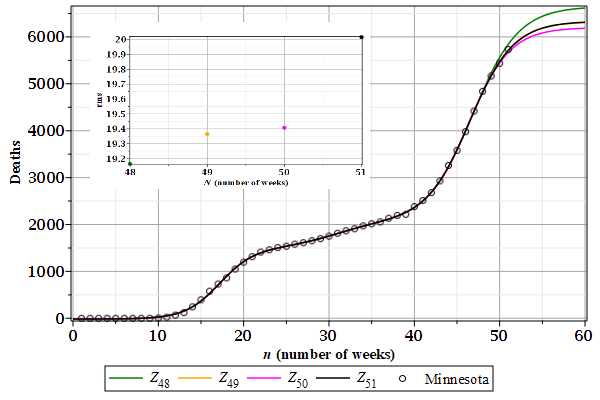
Figures 1 and 2 show the \(Z_{N}(n)\) curves describing weekly cases of contamination and deaths by Covid-19 in Minnesota (MN). The root mean square deviations are shown in the details.
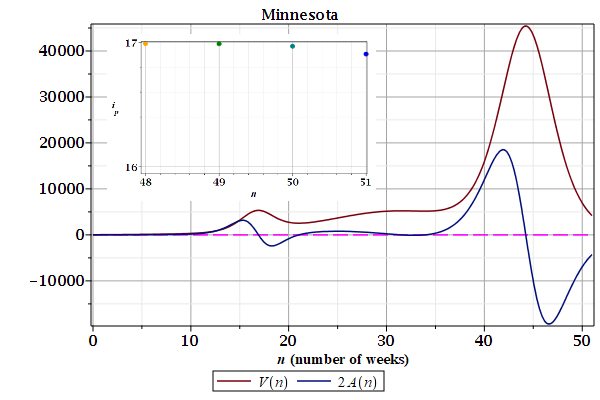
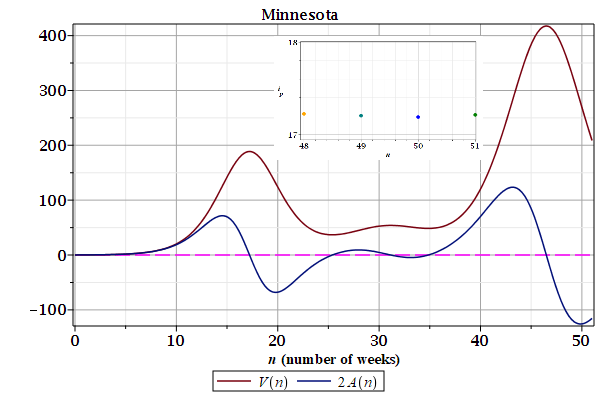
Figures 3 and 4 show the growth rates, speed $V(n)$ and acceleration $A(n)$, derived from the last curves $Z_{N}(n)$. The inflection points $i_{p}$ shown in the details are from the first wave. There are at least three waves.
| Figure 1: Contamination. | Figure 2: Deaths. |
|---|---|
 |
 |
| Figure 3: Contamination.
|
Figure 4: Deaths.
|
|---|---|
 |
 |