Covid-19 Case Fitting Curves
Last update: 29/08/2020
3. Almost Closed Cases
3.1. Spain
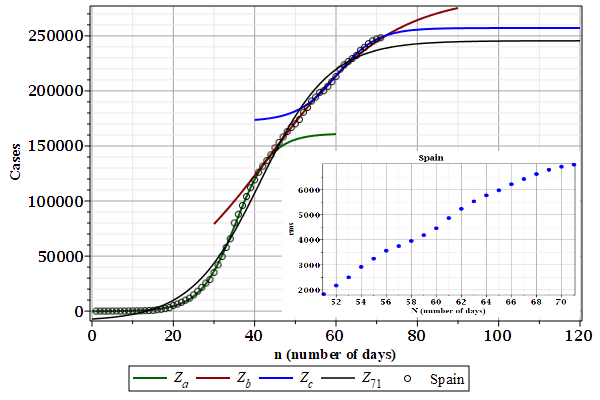
The case data from Spain seems to have three harmonics (or waves). The last wave $Z_{c}$ (blue line) seems to be reaching its flattening. The root mean square (rms) deviations in the inlet were calculated by the fitted curve \(Z_{71}\) using the whole case data.