Covid-19 Case Fitting Curves
Last update: 29/08/2020
3. Almost Closed Cases
3.5. Australia
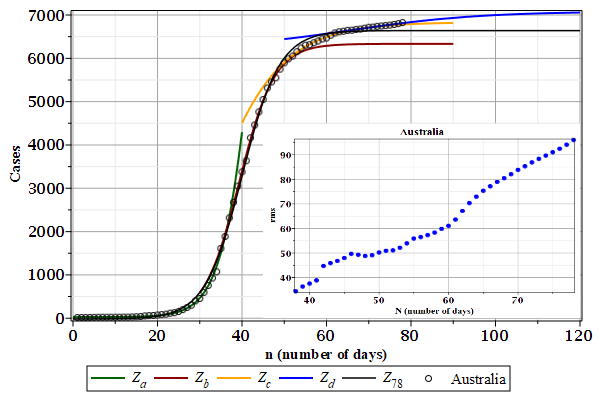
The case data from Australia seems to have four harmonics (or waves). The last wave can keep growing. The root mean square (rms) deviations in the inlet were calculated by the fitted curve \(Z_{78}\) using the whole case data.