Covid-19 Case Fitting Curves
Last update: 29/08/2020
2. Closed Cases
2.1. China
Figure 2 shows the case curves for the complete Covid-19 case data from China. The whole data seems to have a subseries described by the curve \(Z_{21}\) (the violet curve), obtained using the first 21 days, which indicates a (local) flattening of the cases over two weeks (around 53,700 cases). In spite of this curve $Z_{21}$ being a false lead in searching for the case flattening, since we know the whole history, it has all features of a typical (complete) case curve. In fact, a close analysis in this subseries shows an inflection point around $N=14$. Also, while the nearest case curves $Z_{N\leq 21}$ approach $Z_{21}$ in an oscillatory way, all case curves $Z_{N\geq 23}$ approach monotonically the global case curve $Z_{70}$ (the black curve in Figure 2), obtained using the first 70 days in the case data from China, which indicates a flattening around 81,000 cases. Therefore, the (black) curve $Z_{70}$ shown in Figure is the lower limit for all curves $Z_{N\geq 22}$ and has its inflection point around $N=21$. All curves $Z_{N\geq 29}$ converge monotonically and rapidly to $Z_{70}$, giving a 10 days prediction for the (global) flattening. Best parameters for these two curves are shown in Table Par-China.
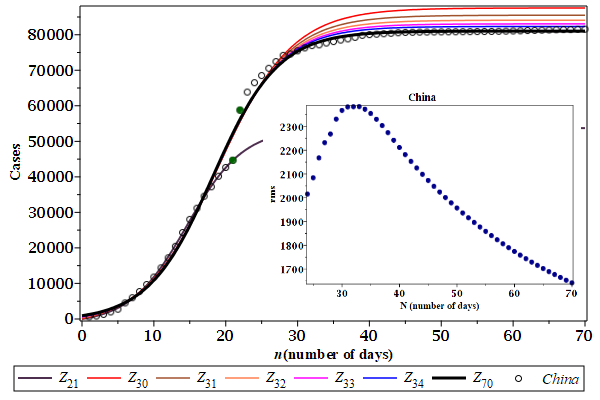
We have learned that the case curves $Z_{N}$ obtained after the inflection point converge monotonically, in an increasing speed, to the global case curve. Of course, mass testing is presumed. Figure rms-China shows the root mean square (rms) deviations of each case curve $Z_{N\geq 22}$, confirming the monotonic convergence.
Some questions. What did happen at day 22? Was it an increase in the total tests? Or is this jump in the number of cases from day 21 to the day 22 (see the solid green circles in Figure Cases-China) a typical feature of the global case curve around its inflection point (where the rate of change is maximum)?