Covid-19 Case Fitting Curves
Last update: 29/08/2020
2. Closed Cases
2.3. New Zealand
New Zealand seems to have reached a global flattening, as we can see in Figure 4. Its case data has one jump at day 31 to 32 and its root mean square deviations are getting smaller (see inlet in Figure 4). There are repeated data resembling jumps at days 19-22 and 25-28, but probably they are not.
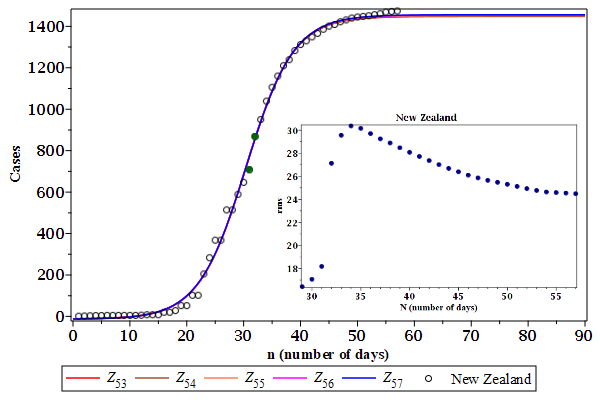
There is a growing oscillation in the case data around the last day fitted curve which can leads to a false flattening, like the case data from South Korea. This growing oscillation can be also the indicative of a second wave in course.